Know where to act —
so your program deliversso your funding worksso your policy sticksso your investment lands
We map the forces behind complex problems — using only your own evidence — and show you the places where interventions are most effective: the shftrs that move the system.
You keep tackling the problem. The system keeps rebuilding it.
For decades, the impact economy has operated on a reductionist assumption: break the problem into parts, solve each part in isolation, measure the outputs. The results are familiar: wins dissolve and problems resurface in new forms. Well-funded interventions generate activity without structural change.
This is not a failure of effort or resources. It is a failure of approach.
Complex systems are governed by interdependencies, feedback loops, and causal architectures that remain invisible to the tools most organizations use. Intervening without a map generates unintended consequences and the recurrence of symptoms from dynamics that were never addressed at source.
shftrs maps these underlying causal relationships and finds where to intervene.
See the system. Find the leverage.
The academically published shftrs methodology synthesizes the most rigorous elements of systems mapping and complexity analysis from leading global traditions.
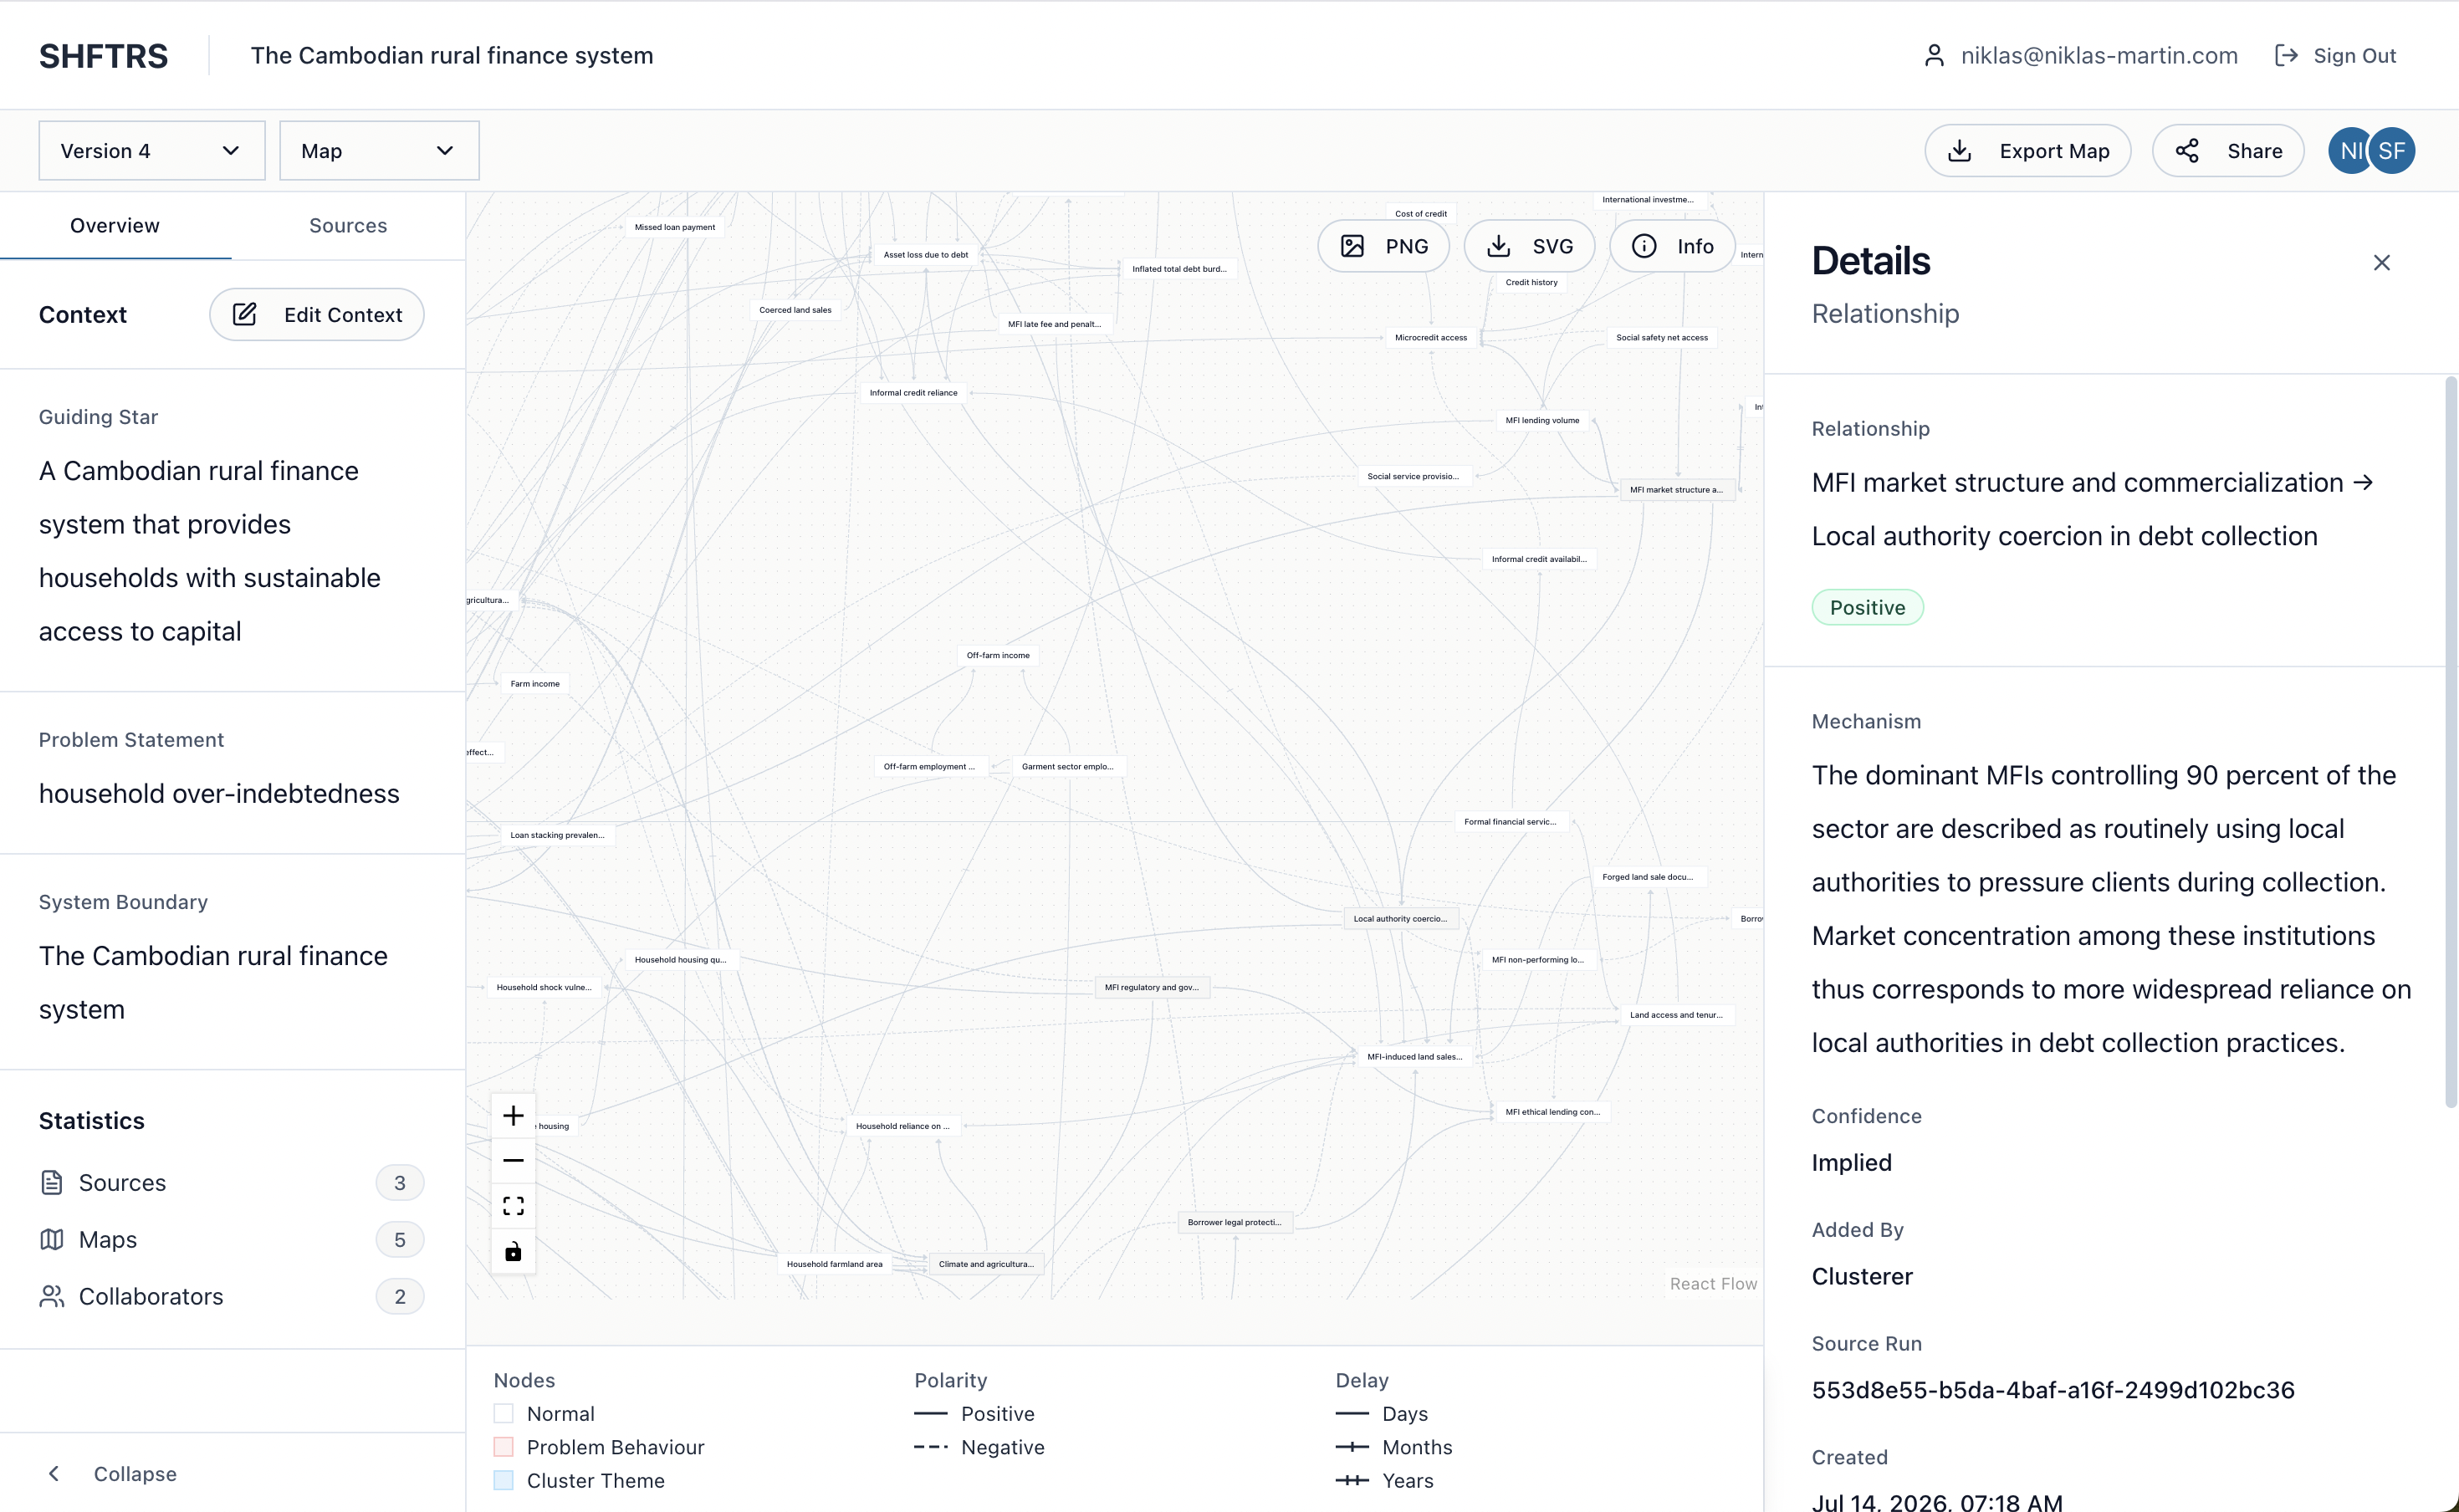
Causal Loop Diagram
A visual representation of the system a client operates within — actors, variables, feedback loops, and causal relationships constituting the real architecture of the challenge. shftrs builds CLDs using exclusively client-provided data: your reports, field notes, interviews, and research. Not a generic LLM's approximation of your context but your system, built from your evidence, and grounded in data you can defend to stakeholders.
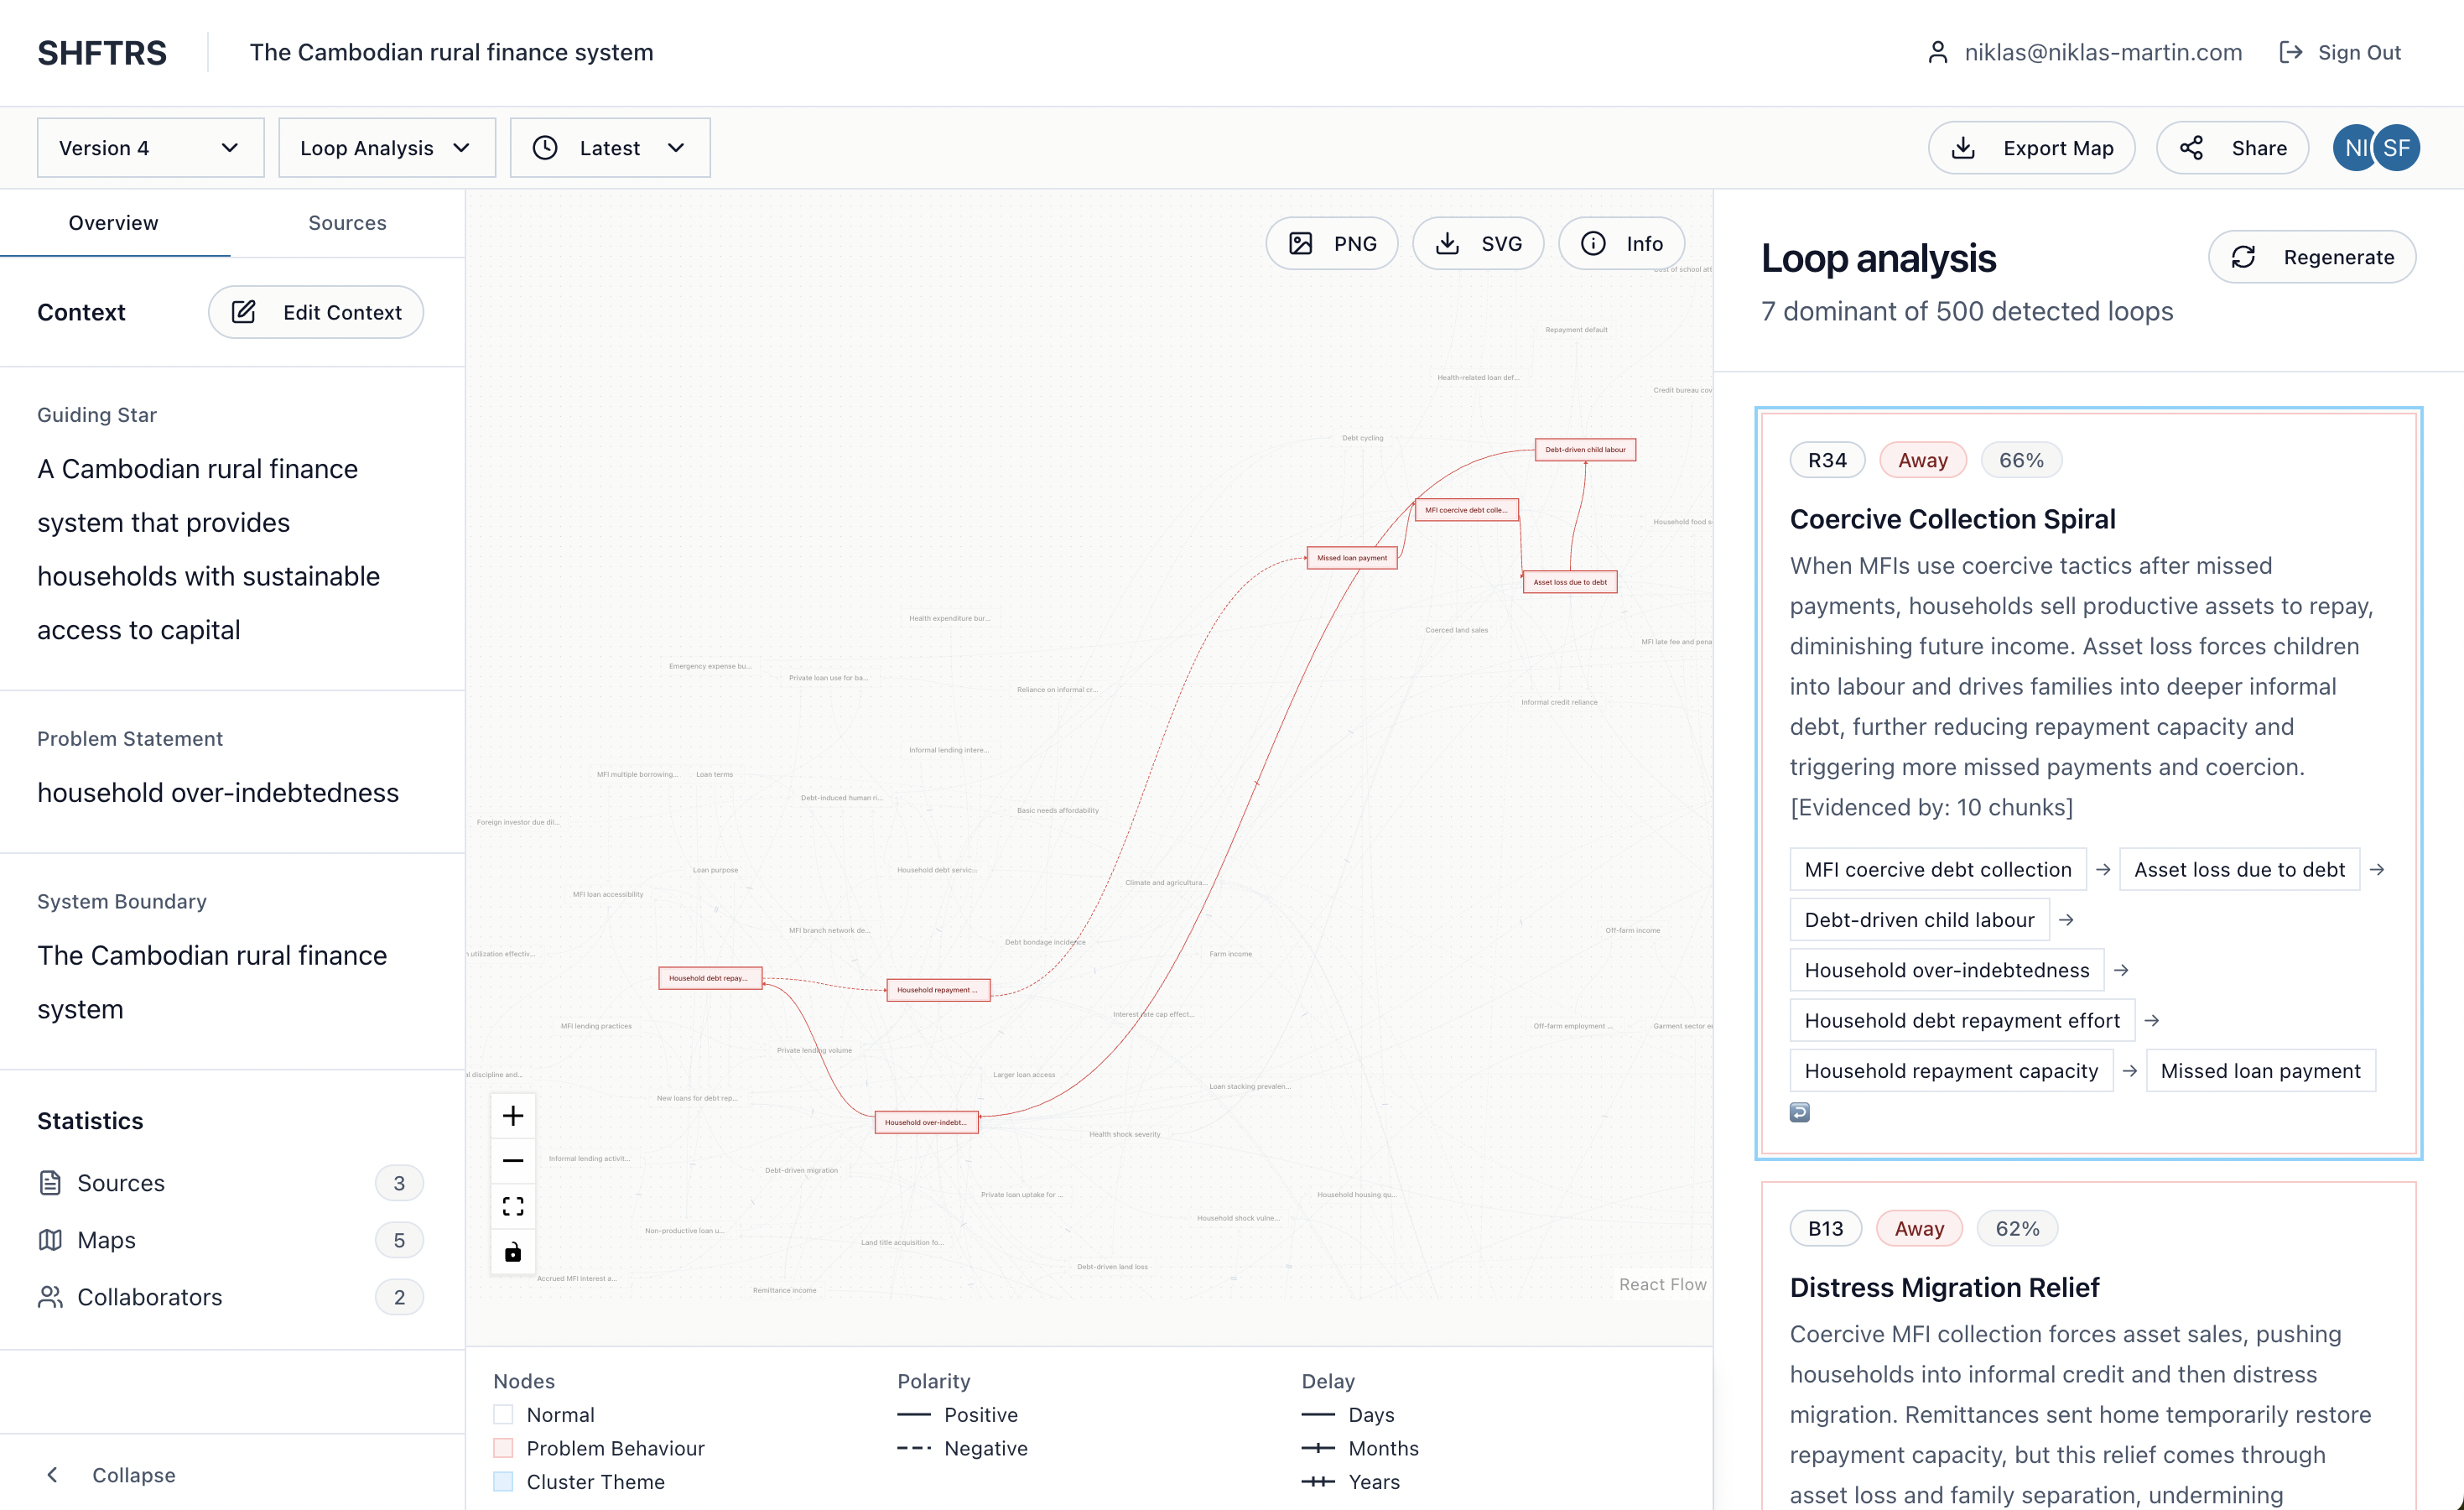
Leverage Point Analysis
Drawing on Donella Meadows' foundational theory — the places in a system where small interventions produce disproportionate, structural change — shftrs applies a suite of analytical lenses to identify where interventions can produce lasting change rather than symptomatic relief. Each of the 15 lenses reveals a different leverage perspective leaning on: system archetypes, performance gaps, power dynamics, system narratives, creative tensions, and many more. The combination is what produces the depth and defensibility that no single-lens analysis can achieve.
A complete foundation for systemic intervention.
A shftrs engagement delivers interconnected outputs — not a report to file, but a working instrument for navigating what comes next.
A visual map of the system — shared, communicable, and validated through participatory rounds that build stakeholder trust before implementation begins. A universal communication medium across your organisation and its partners.
A rigorous, multi-perspective analysis identifying where within the system interventions are most likely to produce structural, lasting change — rather than the symptomatic relief that drives the recurring pattern of illusory wins.
Not just where to intervene, but how — specifying the form of intervention most suited to each leverage point: coalition-building, policy influence, new venture creation, scaling, or combinations. Sequence and priority built in.
A mapping of who to work with, who to neutralise, and in what form — organised by intervention logic, not organisational chart. Built from the same system map, so the connections between actors and leverage points are explicit.
Better decisions begin with better models.
Every map is built only from the evidence you provide, never a language model's training data. Nothing is invented.
Because the analysis reasons only over your sources, every insight traces back to something you can defend — to a board, a funder, or a minister.
Your data is processed on European infrastructure and never transits to US or Chinese servers. Built for GDPR, not retrofitted to it.
Two ways to engage.
It depends on where you are: do you need a full end-to-end engagement, or do you want to experience the methodology before committing to a project?
Full-service systems mapping
End-to-end delivery: from scoping and data collection through CLD construction, multi-lens LPA, Stakeholder Analysis, and Intervention Roadmap — including participatory validation rounds that build the shared ownership essential for implementation.
Includes a formal data protection agreement and full IP ownership of all outputs. The right choice when you need results that are validated, defensible, and ready to present to funders and stakeholders.
Start a conversationSelf-serve systems analysis
Upload your materials and run analytical lenses on your system using the shftrs platform. Experience what the methodology reveals — the feedback loops, structural patterns, and leverage points most analyses never reach.
Run a focused analysis yourself, on your own data, using a subset of the lenses. The fastest way to see the methodology work on a problem you know — and a natural on-ramp to a full engagement when you're ready to go deeper.
Join the beta waitlistReady to map the system?
Whether you have a specific engagement in mind or want to understand what the methodology could reveal in your context, the right next step is a conversation.
shftrs engagements begin with a scoping session — a structured conversation to understand the system, the challenge, and what a well-designed analysis would need to address.